
2017.9.14SAT阅读真题+答案+解析
SAT阅读想要拿高分除了多阅读,还要多练习,多做题,今天上海SAT培训班小编要分享的是出来的SAT阅读真题,快来检测一下你最近的备考结果吧!
The recovery of southern sea otters appears tohave taken an upturn, according to results from theannual California sea otter survey released by theU.S. Geological Survey. Yet despite an overallincrease in sea otter abundance, sharks have been"taking a bite" out of the portion of the population that could fuel expansion into new areas.
"There's much more to the story here than the main finding would suggest," said Dr. TimTinker, a research ecologist who leads the USGS sea otter research program. "We are lookinginto various factors that may be affecting the survey results, including a boom in urchinabundance from Big Sur to Monterey that may explain the uptick in numbers in the rangecenter, and high levels of shark bite mortality that are likely responsible for continued declinesat the north and south ends of the range."
This year's survey results suggest an increasing trend over the last five years of almost 2percent per year and the population index, a statistical representation of the entirepopulation calculated as the three-year running average of census counts, has climbed to3,054 from 2,711 in 2010. The growth is accounted for by an unexpected jump in numbers inthe center of the sea otter's range, an area that spans from Monterey south to Cambria.
While the population index continues to trend upward, the northern and southern subsets ofthe population continue a five-year decline, dropping 2 percent and 3.4 percent per year,respectively, numbers consistent with increased shark bite induced mortality in these sameareas.
Since the 1980s, USGS scientists have computed the annual population index and evaluatedtrends in the southern sea otter, "Enhydra lutris nereis," a federally listed threatened speciesfound in California. For southern sea otters to be considered for removal from threatenedspecies listing under the Endangered Species Act, the population index would have to exceed3,090 for three consecutive years.
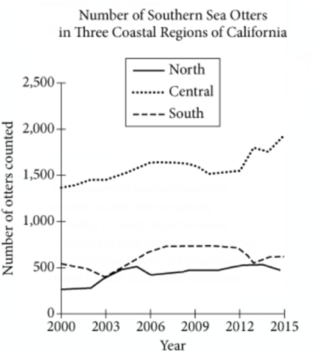
Based on the passage and the graph, what can reasonably be inferred about predatoryshark activity in the south region?
A.It steadily decreased between 2000 and 2003.
B.It affected otters at a consistent rate between 2003 and 2006.
C.It was more of a threat to sea otters in 2003 than in 2009.
D.It was at its highest level in 2009.

答案:C
解析:
Choice C is the best answer. The passage states thatpredatory shark activity has been affecting thesouthern sea otter population in the south subsetsof the coastal range. The graph shows that in thesouth region, there were approximately 400 southern sea otters in 2003 and roughly 700southern sea otters in 2009. Taken together, this information suggests that predatory sharkactivity was more of a threat to sea otters—and decreased their population more—in 2003than in 2009.