


剑桥雅思12Test7雅思写作Task1真题+参考范文
2017年09月07日
剑桥雅思12Test7雅思写作Task1真题+参考范文
题目:The chart below shows how frequently people in the USA ate in fast food restaurants between 2003 and 2013.
Summarise the information by selecting and reporting the main features, and make comparisons where relevant.
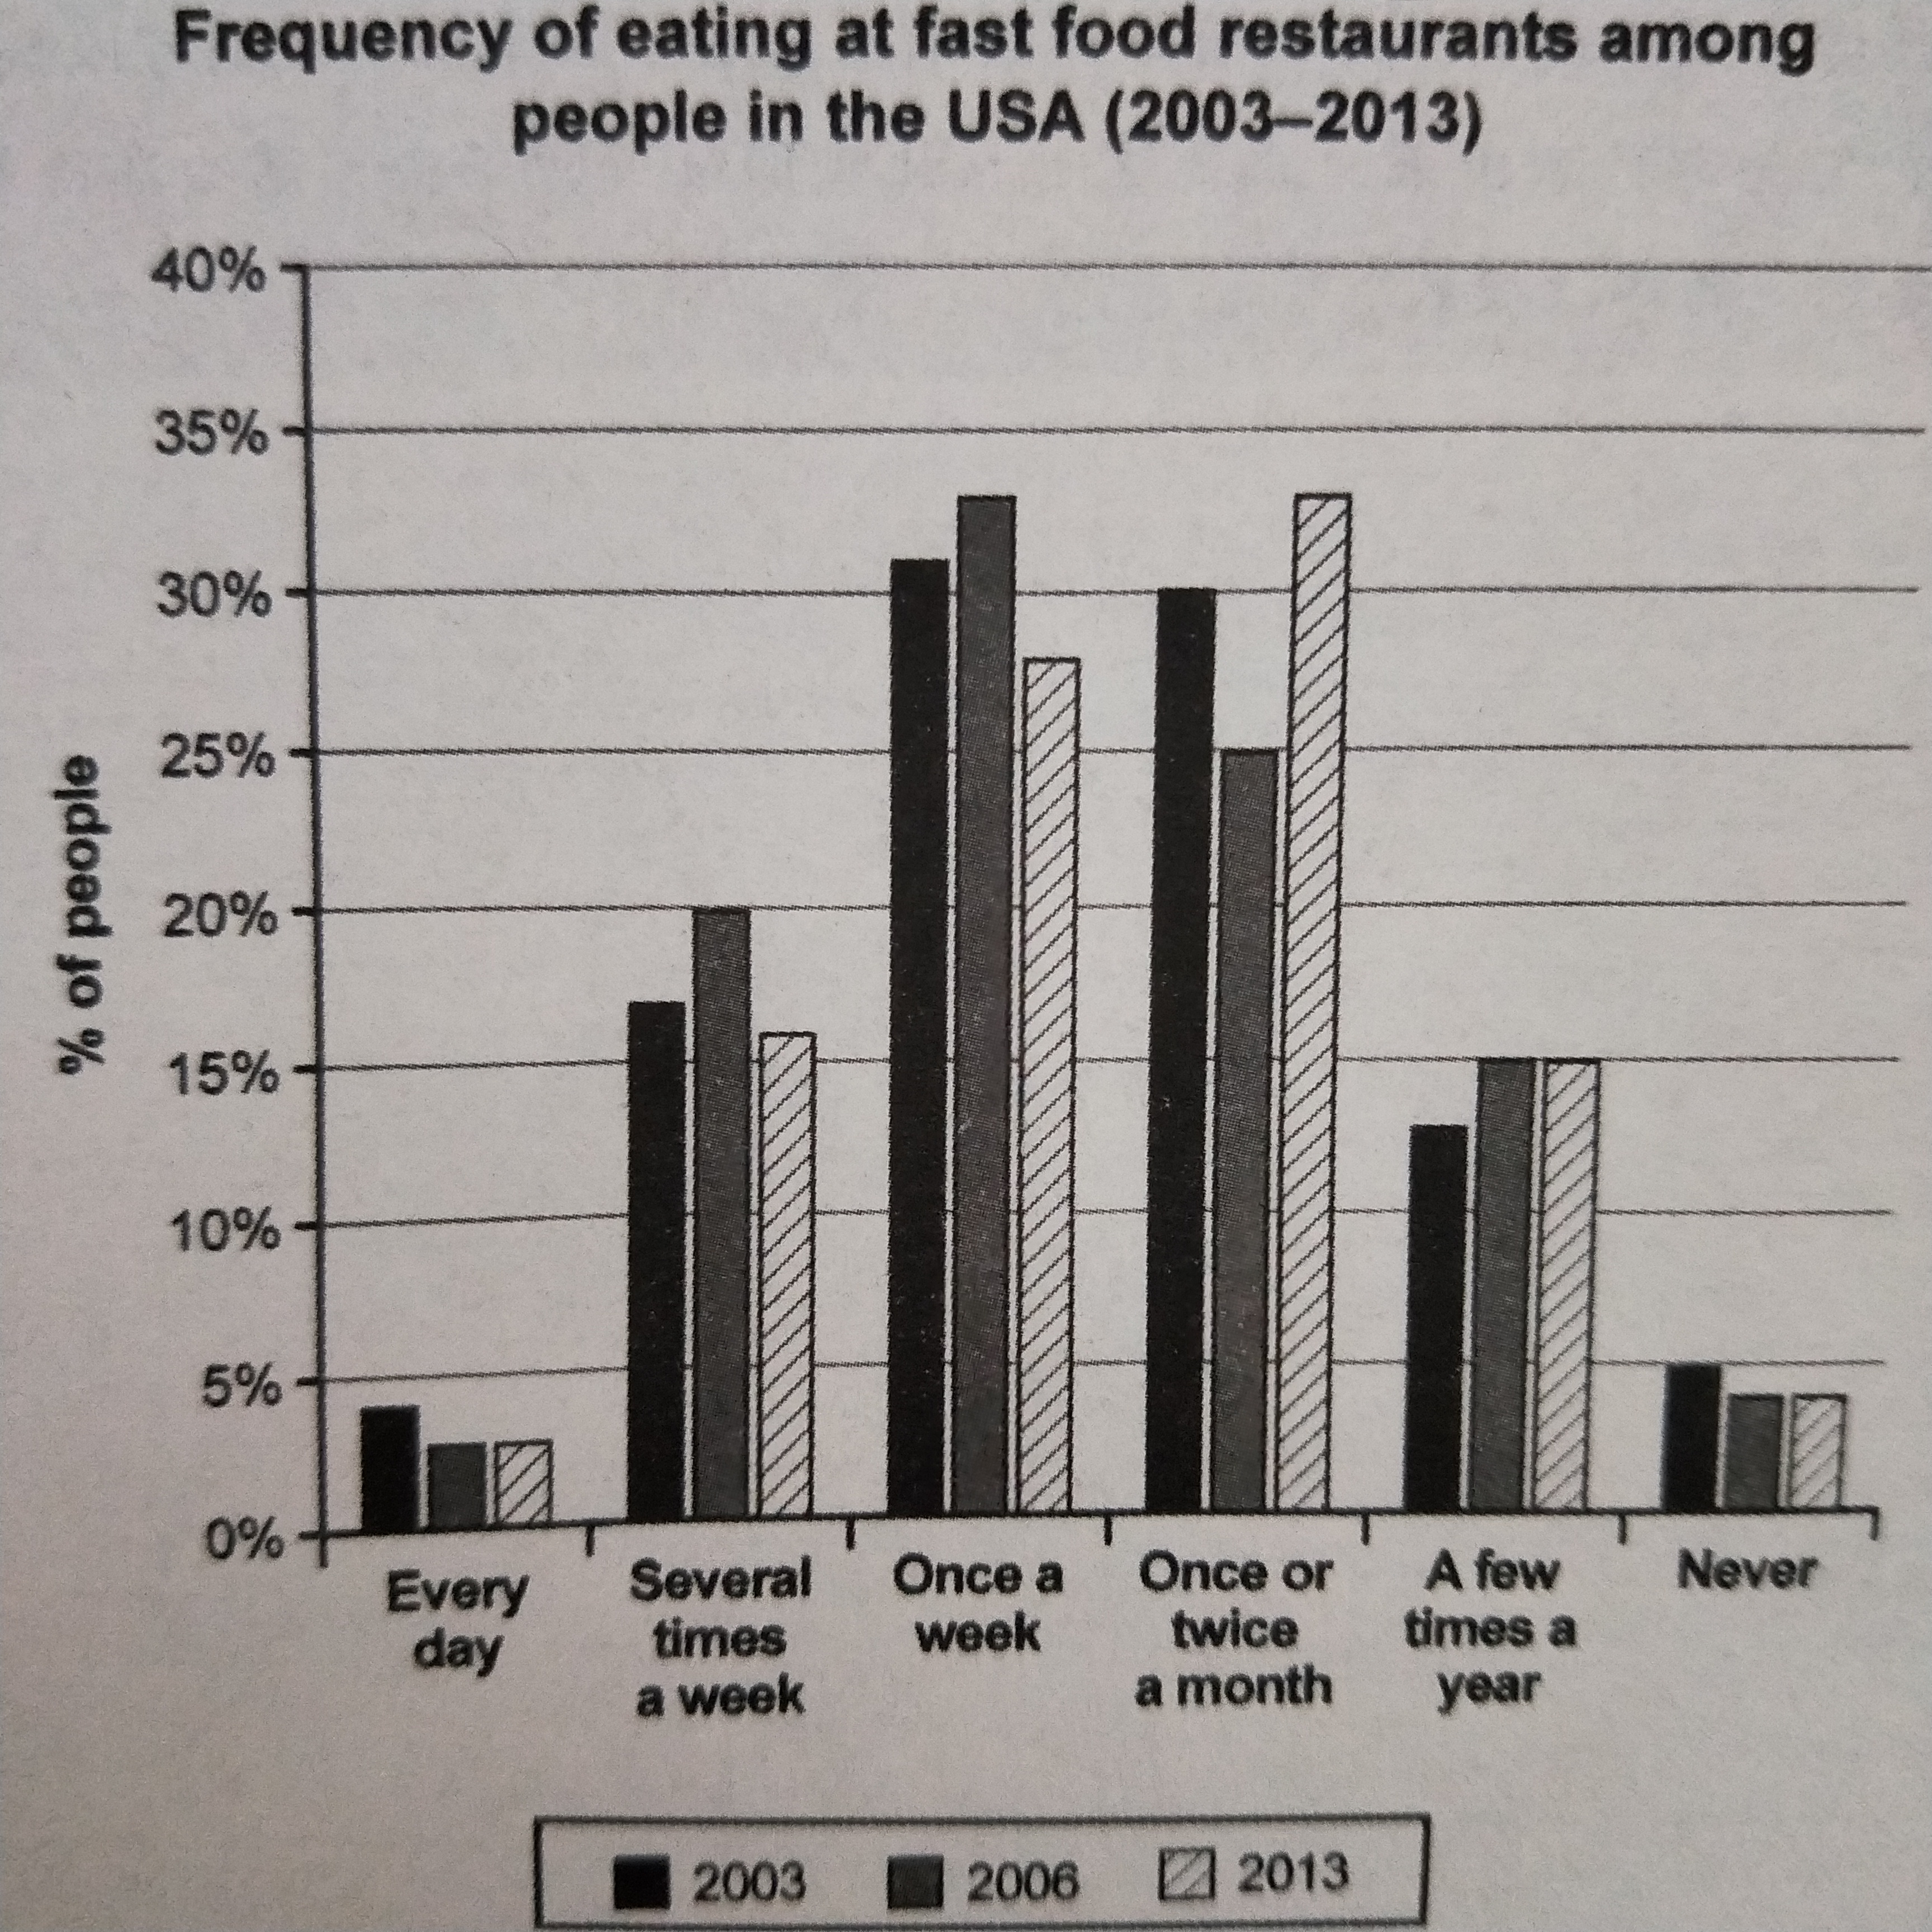
题目分析,包括回答中需要讨论的主要特征、需要进行的对比以及考生可能对题目产生的错误理解。
► ► 要点
L考生要写出三个年份所对应的吃怏餐者比例的升降趋势;
2.考生要对这些比例进行横向比较。
► ► 错误理解
1. 考生可能无法找到很好的逻辑来进行不同对象之间的比较;
2. 考生误把题目中的“数字”当作数量来进行写作,而不是比例;
3. 考生可能会无法在合理的字数内把图表的主要信息概括完整。
参考范文 一
The chart shows how often the US citizens ate at fast-food restaurants in the years 2003, 2006 and 2013.
In 2003, the percentages of people who have never eaten fast food and of people who ate every day were about 5% and 4%, respectively. The figures for both groups declined by almost 1% in 2006 and remained unchanged at this level until 2013.
Most people tended to eat fast food once per week or once or twice per month. The percentage of the former group increased slightly to 33% in 2006 before dropping to 28% in 2013. However, the latter group saw an opposite trend. The figure declined to 25% in 2006 but increased sharply to 33% in 2013.
Turning to the rest of two groups, there was 17% of people eating fast food several times a week in 2003 but it rose to 20% in 2006. A similar increase could also be found in those choosing fast food a few times a year, with the number rising to 15% in 2006 from 13% in 2003. Over the next seven years, the former group fell back to 16% while the latter saw no change.
To summarise, it can clearly be seen that most people over this period only eat fast food between 1 and 4 times a month.
参考译文 一
此图显示了美国民众在2003年、2006年及2013年前往快餐店消费的频率。
在 2003年,从来不吃快餐的人数比例以及每天吃快餐的人数比例分别占5%和4%。两组的人数比例在2006年均下滑约1%,并且到2013年其數据一直保持不变。
大多数人往往一个星期吃一次或一个月吃一到两次快餐。前者人数比例缓慢增长到 2006年的33%,之后下降到 2013年的28%。然而,后者则见证了相反的趋势。该百分比下降到了 2006年的25%,但到了 2013年增加到了 33%。
对于剩下的两组人群来说,在 2003年,一周吃数次快餐的人数比例约为 17%,但之后增长到2006年的20%对于一年吃几次快餐的比例也同样有所增加,这个比例增长至 2006年的15%,而2003年为13%。在未来的七年里,前者比例下降到 16%,而后者比例几乎保持不变。
总之,明显可以看出大多数人在此期间每月仅吃一到四次快餐。
参考范文 二
The chart shows the frequency of eating at fast-food restaurants among the US people in the years 2003, 2006 and 2013.
From 2003 to 2006, a slight decline could be found in the percentages of people who had never eaten at a fast food restaurant (5% to 4%) and that of those eating fast food everyday (4% to 3%). The next seven years saw almost no changes in both groups.
The major changes could be seen in the groups who ate in fast-food restaurants once, several times per week or once or twice a month. Compared with other groups, most US citizens ate fast food once a week or 1-2 times a month. These figures ranged from a little over 30%, in 2003, rising slightly in 2006 and then dipping to around 28% in 2013 for the once a week and then 30% to 25% and then up to 33% for those people eating it around once a fortnight.
As for those ate fast-food a few times a week or a few times a year, their percentages were relatively lower. The number of the former group increased by 3% to 20% in 2006 before falling to 16% in 2013, while that of the latter group remained almost unchanged at 15% during the same period.
参考译文 二
此图显示了美国民众在2003年、2006年及2013年在快餐店吃快餐的频率。
在 2003年 至 2006年间,从来不吃快餐的人数比例以及那些每天吃快餐的人数比例分别从5%下降到4%以及4%下降到3%。在接下来的七年中,该两组人群比例保持不交。
每周吃快餐一次、数次的人数比例以及一个月吃一到两次的人数比例经历了巨大的变化。相比于其他人群,一周吃一次快餐以及一个月吃一到两次快餐的人数最多。一周吃一次快餐的人数比例在2003年略高于30%,2006年略有上升,然后在2013年下降到 28%左右,然后那些一周吃两次左右的人数比例从30%降到25%然后又上升到33%。
对于那些一周吃几次快餐以及一年吃几次的人来说,这两组比例相对较低。前者上升了3%达到2006年的20%,之后下降到2013年的16%,而后者在同期内几乎维持在15%的水平。